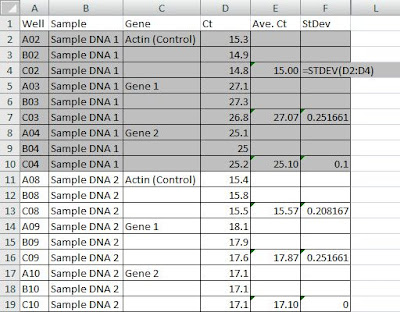
 Step 1. Once qRT-PCR is completed and Ct values obtained, enter all Ct values in Excel. Three Ct values (triplicates) should be obtained from each sample. Similar Ct values of each of the triplicate indicate low experimental error, which usually comes from pipetting error.
Step 2. Calculate the average of your Ct values in an adjacent column (E) and calculate standard deviation from your three values using Excel formula (=STDEV(range of your data))

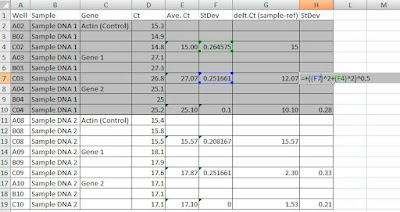
Step 3. In the next step normalize your data to a reference control (in this case actin) by subtracting your average Ct values from reference Ct value. For example: 27.07-15.00 = 12.07 as shown in figure 3. Propagate standard deviation by taking a square root of a sum of squares standard deviation values as shown in figure 3.
 Step 4. In the next step normalize your data between different samples: for example treated samples vs non-treated. Let's say Sample DNA 2 came from treated organism and Sample DNA 1 is a control non-treated. If one is looking at changes in gene 1 between the two samples it's necessary to subtract delt. Ct value of gene 1 in Sample DNA 2 (treated) from delt. Ct value of gene 1 in Sample DNA 1 (non-treated) - shown in cell I26. All the values in non-treated sample will become zero.
 Step 5. Final step is extrapolate fold change from the Ct values. This is done by raising 2 to the power of negative delta-delta Ct (2^-(delt.deltCt), where delt. deltCt is the value calculated in step 4. To propagate standard deviation follow the formula:=+((2^-(I16-H16))-2^-(I16+H16))/2 (example from figure 5 - I16 not J16, sorry).
Final data can be summarized in a table format before graphing. Data can be graphed in a number of ways.
I hope this little qRT-PCR data analysis tutorial will come in handy.
hey,
ReplyDeletethanks ur tutorial is very helpful.. but after all these calculations, i need to calculate the standard deviation of the ratios...can u help me with that?
Great tutorial! Thanks.
ReplyDelete